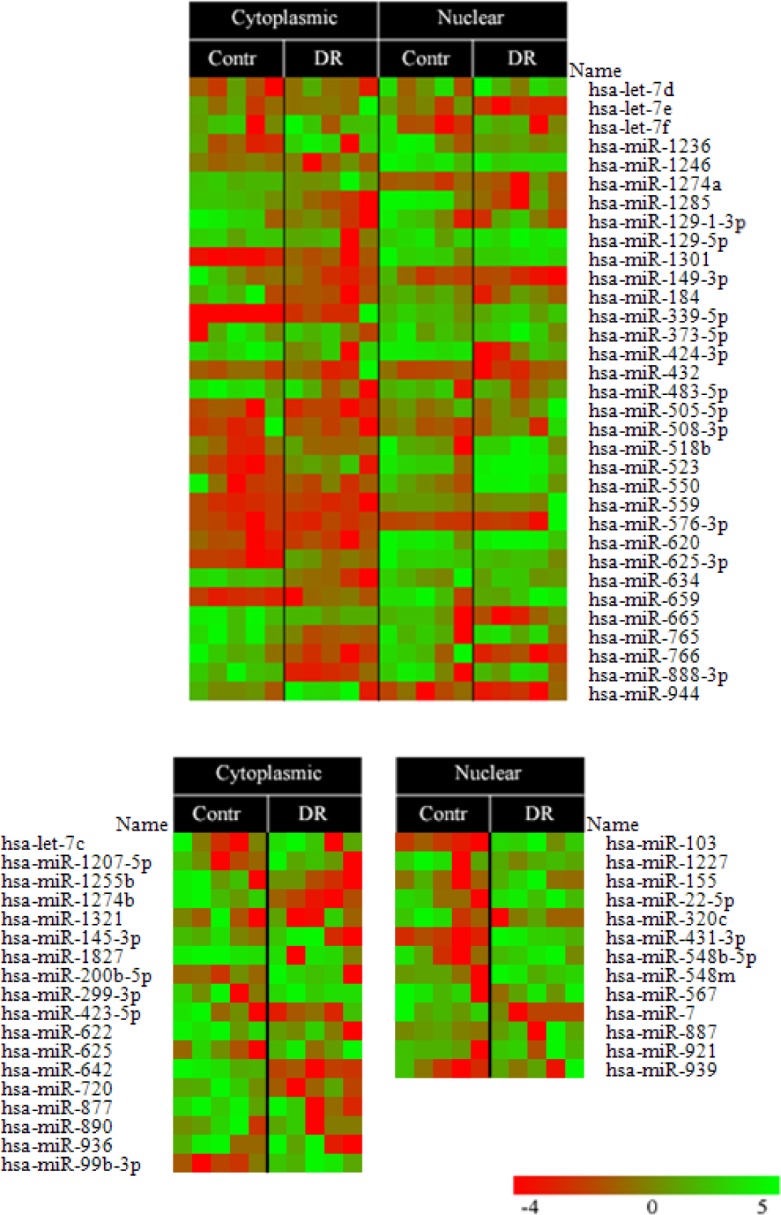
Figure 3. A heatmap of miRNA expression levels isolated from cytoplasmic and nuclear proteasomes non-treated (Contr) or treated with doxorubicin (DR).

Two micrograms of proteasome-associated RNA (pa-RNA) were used for hybridization with custom microarrays of miRNAs. Fold difference in hybridization signal is shown as a colored bar where red color denotes the lowest signal and the green one – the highest.
