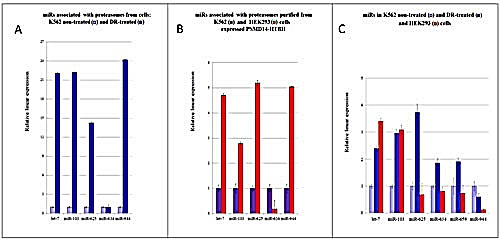
Figure 4. (Q)RT-PCR comparative analysis of pa-miRNAs levels in K562 and HEK293 cells.

(A) Comparison of expression levels of individual pa-miRNAs isolated from K562 cells non-treated or treated with DR. Changes in microRNA levels were determined by QRT–PCR and normalized against the U6 RNA signal. The values are presented as mean fold change ± SEM (n = 3). (B) Comparison of expression levels of individual pa-miRNAs from the DR-treated K562 and HEK293 cells. (C) Cellular levels of individual miRNAs in HEK293 cells and K562 cells non-treated or treated with DR. Samples were normalized against the miR-659 signal, which was identical in these cells. Levels of microRNAs in non-treated K562 cells were arbitrary set as 1.
