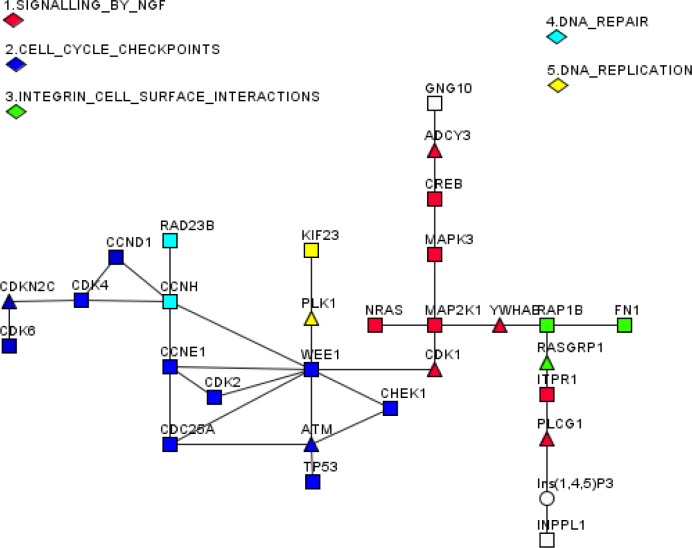
Figure 5. A connectivity map of genes targeted by DR-affected pa-miRNAs.
Genes that are targeted by pa-miRNA (squares), whose association with proteasomes is affected by DR treatment, were connected into five statistically significant cellular pathways with maximal gap of two intermediates (triangles). Connecting metabolites are shown as circles. Only those pa-miRNAs were scored as affected by DR and thus used for subsequent analysis, which showed >1.5 fold difference in the level of expression upon DR on at least three different probes.

