
Figure 2. MMP-12 down-regulation correlates with high levels of full length uPAR and A375 invasiveness.
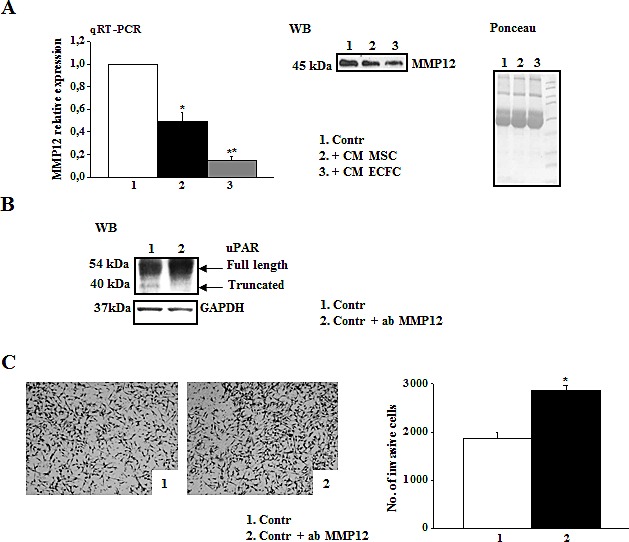
Panel A: MMP12 levels of A375 were examined by qRT-PCR in control condition or after overnight treatment with CM-MSC or CM-ECFC. Results are normalized to control (assumed as value 1). Asterisks indicate significant difference (* P<0.05; ** P<0.001) from control. MMP12 released in the medium by the same cells was evaluated by Western blotting (on the right). The result is representative of three separate experiments. Ponceau on the right shows equal loading. Panel B: Western blotting analysis of uPAR expressed by A375 cells in control condition and in the presence of anti-MMP12 antibody. Result is representative of three independent experiments. Panel C: Pictures represent the Matrigel-coated filters of an invasion experiment of A375 cells in the same experimental condition described above (panel B). Histogram shows the quantitative analysis of Matrigel invasion. Asterisks indicate significant difference (* P<0.05) from control.