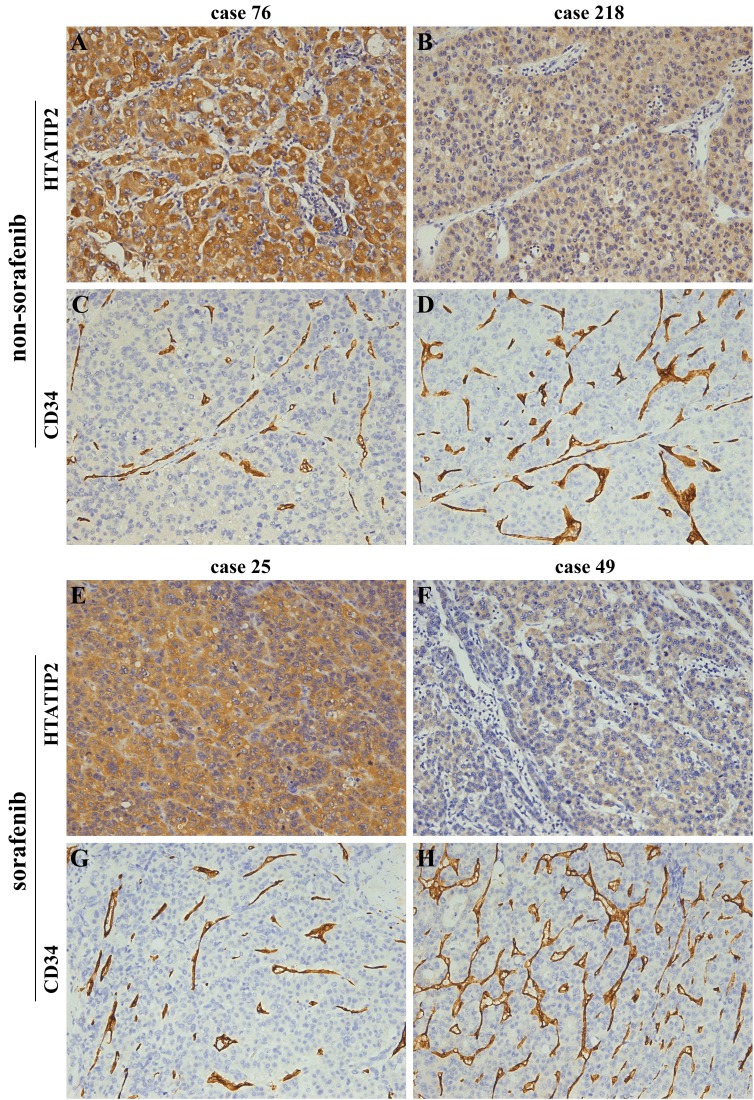
Figure 1. Images from representative samples with high or low HTATIP2 expression and microvessel density (MVD, indicated by CD34) as determined by immunostaining of tissue microarrays.
(A and C) Case 76 in cohort 1 and (E and G) case 25 in cohort 2 showed high HTATIP2 but low MVD; by contrast, (B and D) case 218 in cohort 1 and (F and H) case 49 in cohort 2 showed low HTATIP2 but high MVD (×200).

