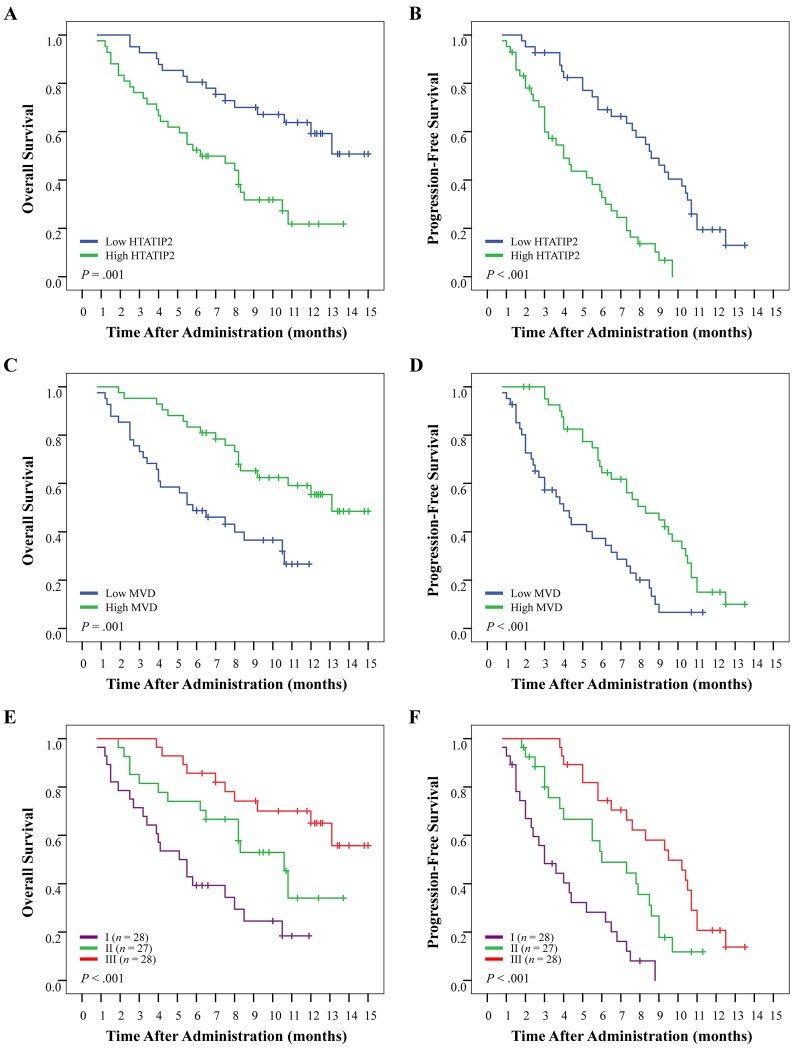
Figure 4. Cumulative overall survival (OS) and progression-free survival (PFS) curves of 83 sorafenib-administered patients with advanced-stage hepatocellular carcinoma.
Patients were classified into the high- or low-HTATIP2 expression group and into the high- or low-MVD group according to HTATIP2 density and MVD value, respectively; these subgroups were recombined into three groups for further analyses (see Results for details). (A and B) High HTATIP2 and (C and D) low MVD were associated with poor OS and PFS. (E and F) The combination of high HTATIP2 and low MVD suggested the shortest OS and earliest disease progression.

