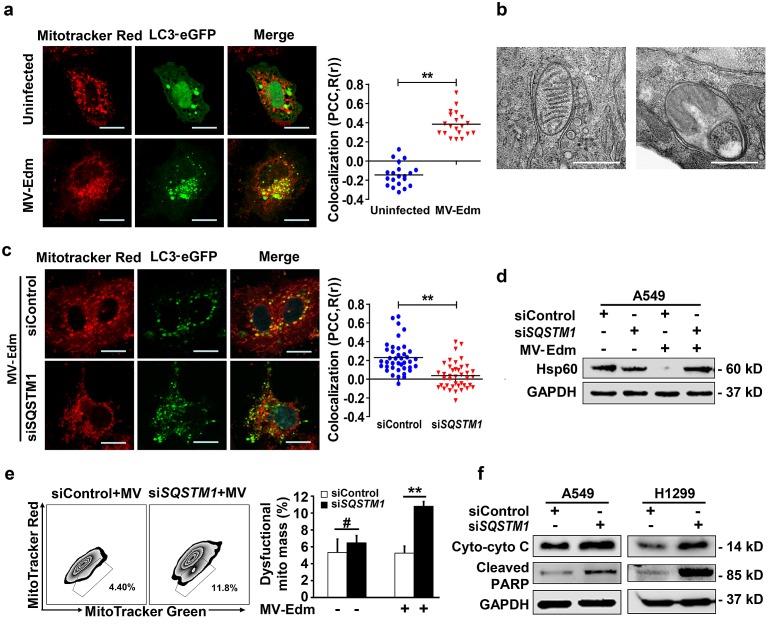
Figure 4. MV-Edm induces mitophagy to control cytochrome C release in NSCLCs.
(a) A549 cell were transiently transfected with a plasmid encoding EGFP-MAP1LC3B for 24 h and infected with MV-Edm at a MOI of 1 for another 12 h, or left uninfected. Cells were then stained with Mitotracker red and subjected to confocal microscopy. Scale bars represent 10 μm. Colocalization (yellow dots) of mitochondria (red) with autophagosomes (green puncta) was quantified by calculating Pearson's correlation coefficient (PCC, R(r)) (right panel). Means are shown (n = 30 of each). (b) Subcellular structures were analyzed by electron microscopy in cells infected with MV-Edm at a MOI of 1 for 24 h. Left panel shows a double-layered membrane engulfing a mitochondrion (early stage of mitophagy), and right panel shows a double-layered membrane containing a degraded mitochondrion (late stage of mitophagy). Bars represent 0.5 μm. ** indicates p < 0.01. (c) Colocalization of autophagosomes and mitochondria was quantified in A549 cells transfected with SQSTM1 siRNA for 24 h followed by transfection with pEGFP-Map1lc3b for another 24 h. Cells were then infected with MV-Edm at a MOI of 0.5 for 12 h and stained with Mitotracker Red before subjected to confocal microscopy (left panel). Scale bars represent 10 μm. Colocalization (yellow dots) of mitochondria (red) with autophagosomes (green puncta) was quantified by calculating Pearson's correlation coefficient (PCC, R(r)) (right panel). Means are shown (n = 30 of each). (D & E) A549 cells transfected with siRNA targeting SQSTM1, or a non-specific control siRNA for 24 h. Then cells were infected with MV-Edm at a MOI of 0.5 for another 48 h, or left uninfected. (d) The cell lysates were harvested and the mitochondrial HSPD1 (Hsp60) protein levels were determined by Western blot. A representative result from two independent experiments is shown. (e) Cells were incubated with mitotracker green and red before subjected to FACS analysis. Gated subpopulations depict damaged mitochondria (left panel). Percent of injured mitochondria was quantified (right panel). Means + SD of 3 independent experiments are shown. (f) A549 and H1299 cells were transfected with siRNA targeting SQSTM1 or non-specific control siRNA for 24 h, cells were then infected with MV-Edm at a MOI of 0.5 for another 48 h. Cytoplasmatic cytochrome c and cleaved PARP were evaluated by Western blot. A representative result from two independent experiments is shown. # p > 0.05, * p < 0.05, ** p < 0.01.

