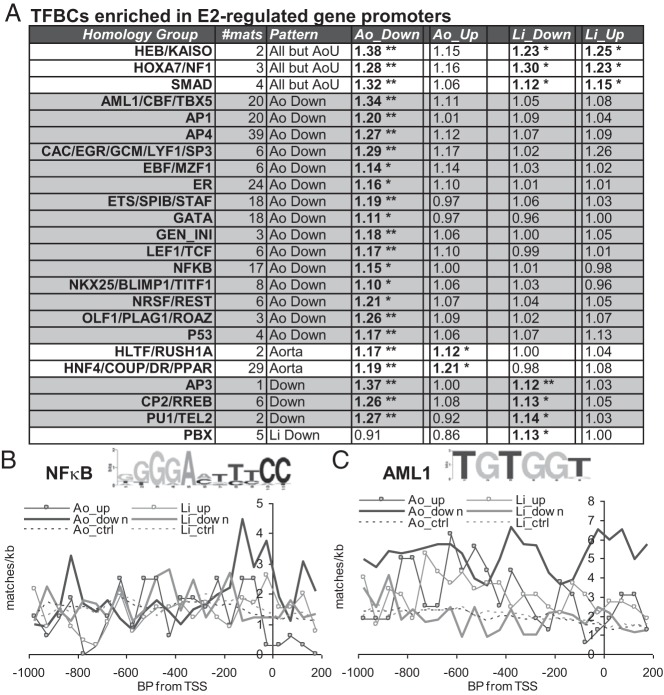
Figure 3.
A, Homology groups of TFs whose TFBCs are enriched by ≥1.1-fold, with median Benjamini-Hochberg adjusted P ≤ .05 for enrichment for one or more classes of E2-regulated promoters (Ao, aorta; Li, liver; Up, E2–up-regulated; Down, E2–down-regulated). *,c Adjusted P < .05; **, adjusted P < 1e−4. # mats is the number of separate TFBC matrices in that homology group, and Pattern provides a summary of the set or sets of regulated promoters that, individually, show significant enrichment for that homology group. B and C, Average site frequencies per kilobase for representative matrices from the NF-κB (B) and AML1 (C) groups (TRANSFAC matrices V$NFKAPPAB_Q6 and V$AML1_Q6) were plotted relative to the TSSs of the indicated promoter sets. Dotted lines, background frequencies for expressed but not E2-regulated control genes in liver and aorta. Insets, WebLogo diagrams (44) of these position frequency matrices (with base height related to the information content associated with enrichment of that base).

