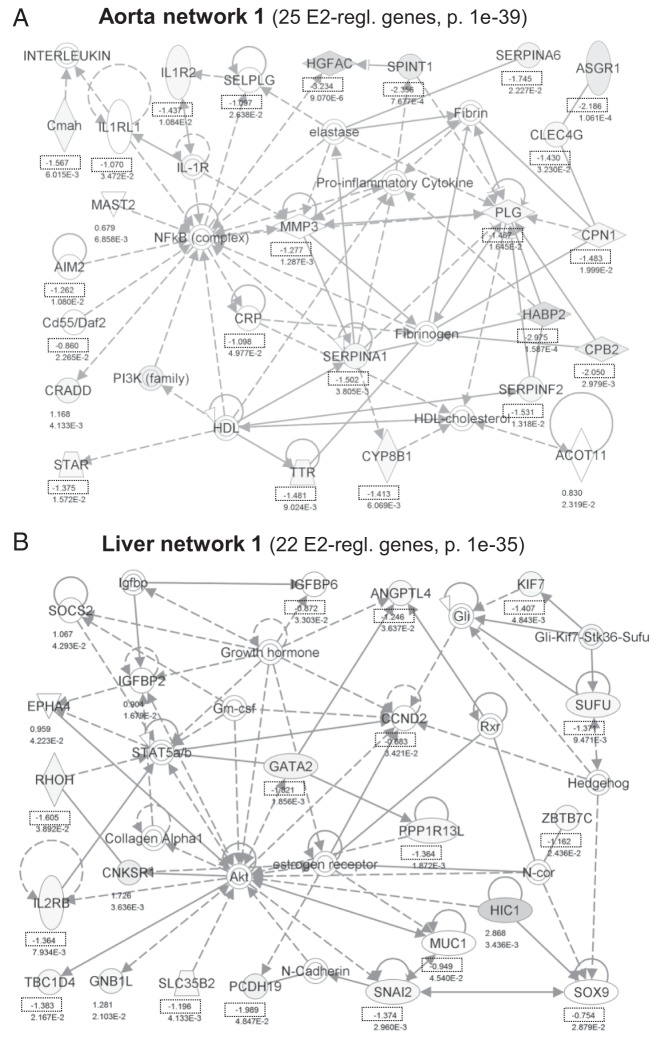
Figure 5.
IPA networks showing protein-protein or regulatory interactions between E2-regulated genes in aorta (A) or liver (B). Shown are the top networks by number of incorporated E2-regulated genes and P value. P values indicate the probability that a network with the same number and character of interaction lines would occur by chance. Numbers give the log2 fold change values for each significantly E2-regulated gene. Dotted boxes highlight E2 down-regulation (negative log2 values).

