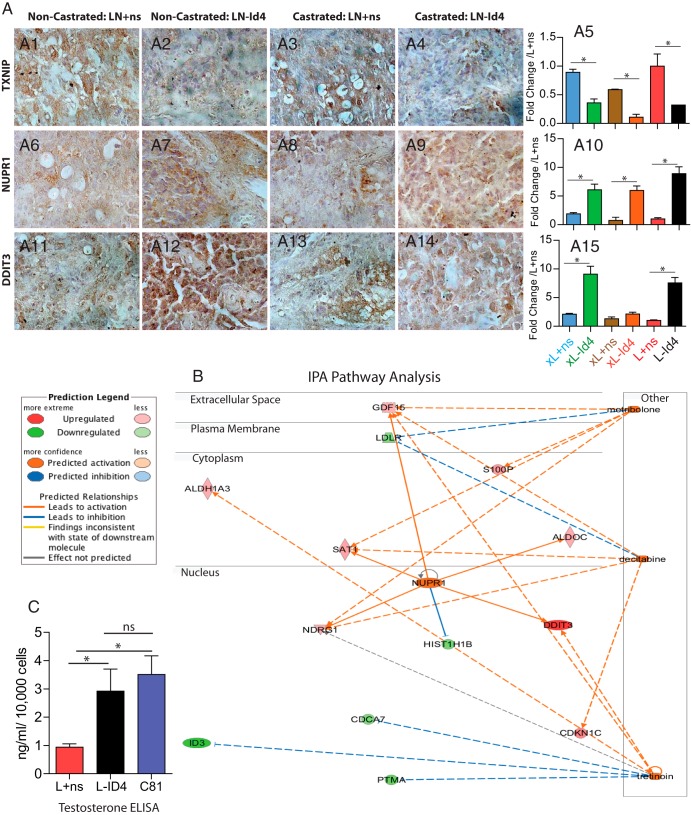
Figure 5.
Comprehensive pathway, network analysis, and expression of significantly regulated genes in L+ns and L-ID4 cells and xenografts. A, Immunohistological analysis of the 3 most highly regulated genes in L+ns and L-ID4 detected by next-generation sequencing (RNA-seq) (Table 1). A1–A4, TXNIP. A6–A9, NUPR1, A11–A14, DDIT3. Representative images at ×400 are shown. A5, A10, and A15, expression of TXNIP (A5), NUPR1 (A10), and DDIT3 (A15) by real-time qRT-PCR in RNA isolated from tumor xenografts (indicated by prefix x) and L+ns and L-ID4 cell lines. The expression is normalized to the respective mRNA expression in L+ns cell lines (means ± SEM; *, P < .001). B, Pathway and network analysis of the 41 most regulated genes (shown in Table 1). Three major pathways were detected (metribolone (R1881), decitabine (5-azacitidine), and tretinoin (retinol). See the legend on the left for additional descriptions. C, Testosterone ELISA on L+ns, L-ID4, and C81 conditioned media. Testosterone levels (means ± SEM of 3 experiments in triplicate) are represented as nanograms per milliliter per 10,000 cells. C81 cells were used as positive controls. ns, not significant.

