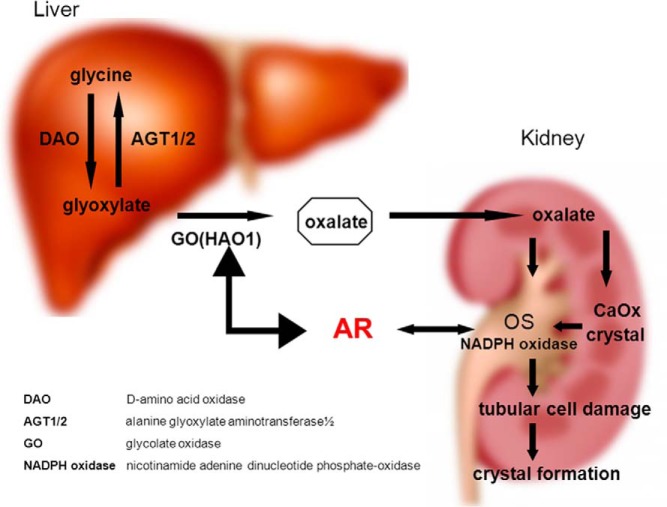
Figure 7.
A schematic diagram summarizing the results. The diagram shows AR roles in CaOx crystal formation via the AR liver-kidney axis. For the liver part (left-hand side), AR signaling promotes activity of GO in the liver, which increases the biosynthesis of oxalate by converting glyoxylate into oxalate. For the kidney part (right-hand side), AR signaling increases the activity of NADPH oxidase p22-PHOX, which induces the injury to kidney epithelial cells and then further increases CaOx crystals on the damaged cell surface.

