
Figure 1.
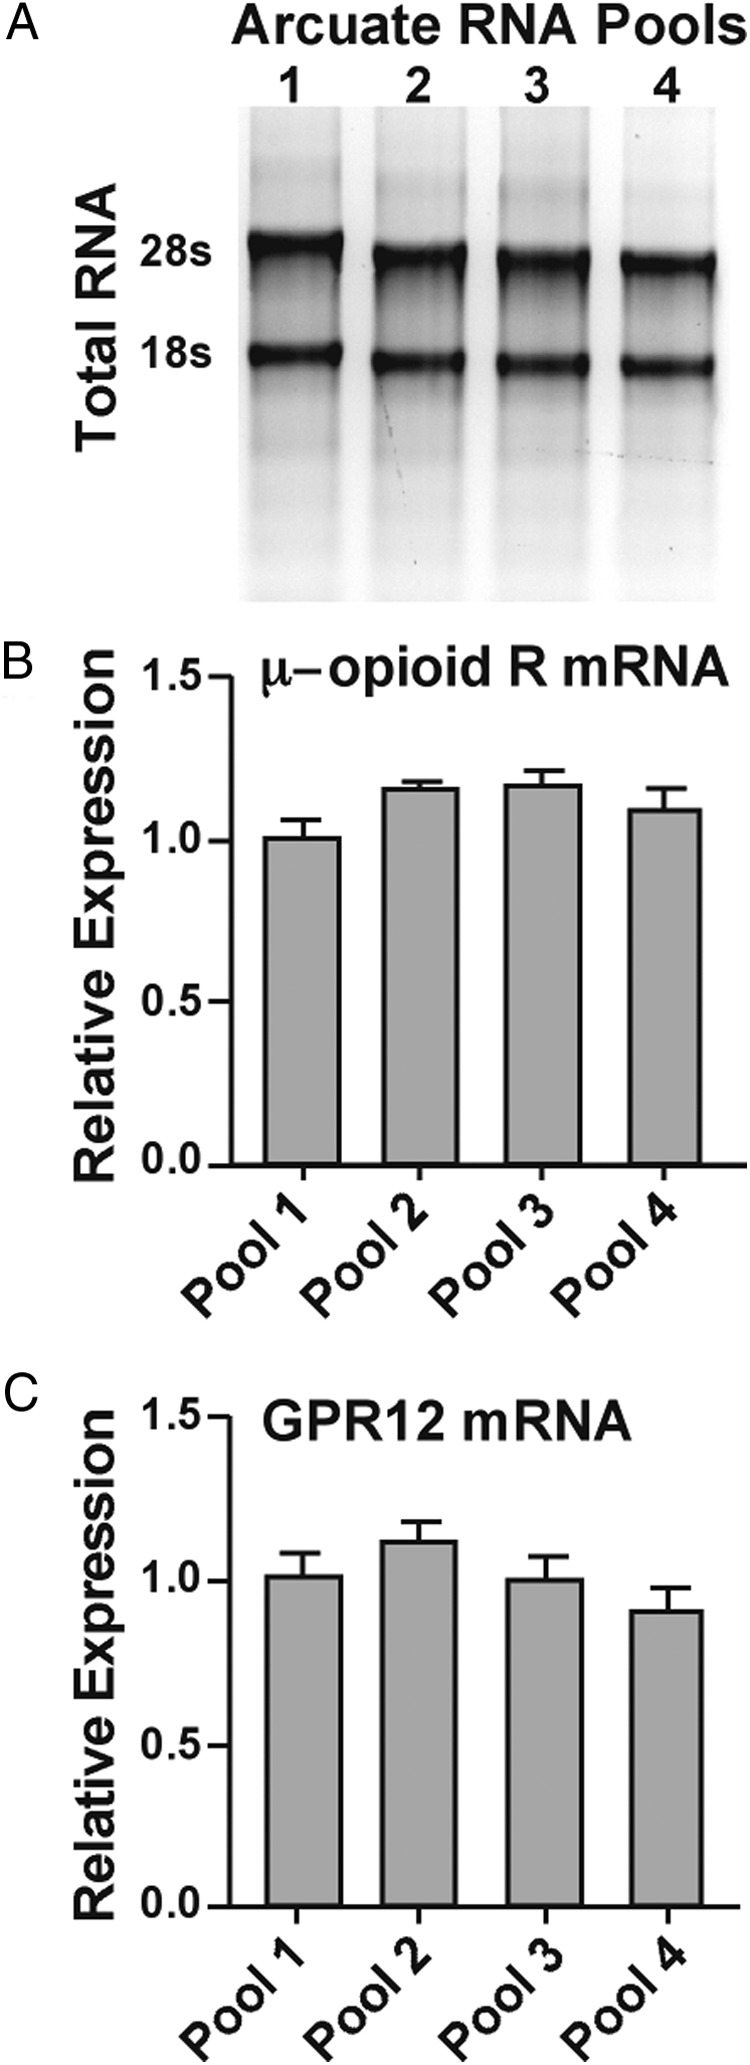
Assessment of RNA quality in the samples used for PCR array analysis. A, Samples containing 250 ng of RNA from arcuate pools 1 to 4 were run on a 1.2% denaturing agarose gel in 1× MOPS buffer and visualized with ethidium bromide. The gel depicts 2 distinct ribosomal RNA bands (28S and 18S) for each sample. B and C, μ-Opioid receptor (μ-opioid R) and GPR12 mRNA levels were measured in the 4 independent RNA samples from arcuate nuclei using reverse transcription and real-time qPCR. This was done to ascertain that there were no significant differences in RNA expression measured in the 4 independent samples to be used for PCR array determinations.