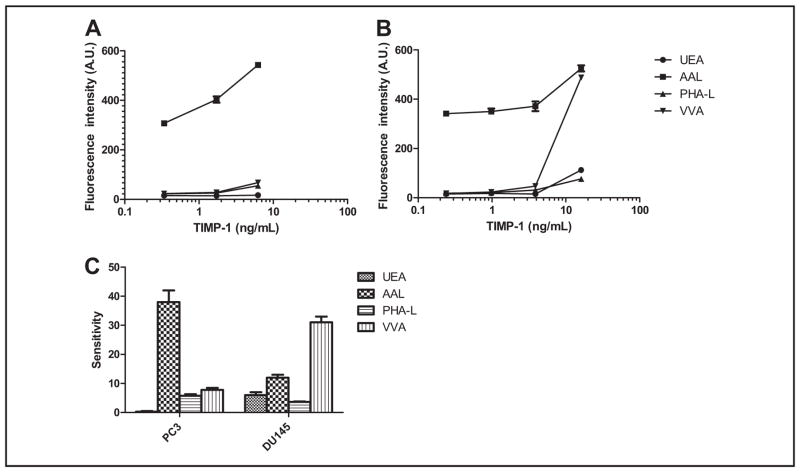
Fig. 3. Dose–response curves of the LISAs for TIMP-1 from culture media of PC3 cells (A) and DU145 cells (B).
C, comparison of glycan profiles of TIMP-1 from PC3 and DU145. Protein concentrations of TIMP-1 in these samples were quantified by TIMP-1 immunoassay and plotted against the signals detected in these samples by LISAs. The plotted results are shown as the dose–response curves. A.U., arbitrary units.

