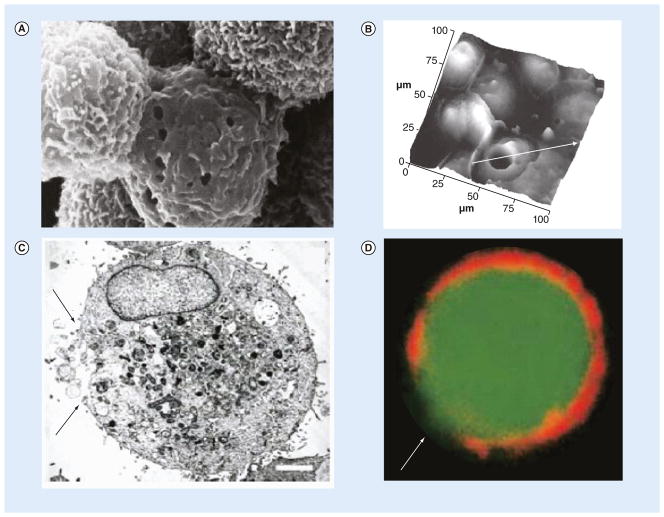
Figure 4. Direct observation of pore formation after sonoporation.
Observations used (A) scanning electron microscopy, (B) atomic force microscopy, (C) transmission electron microscopy and (D) confocal fluorescence microscopy. (A) The magnification is 10,000 ×. (B) The white arrow passes through the pore; the cross-sectional plot over the line is given in [8]. (C & D) The scale bar is 1 μm, and the arrows point to the areas of cellular membrane disruption.
(A) Reproduced with permission from [56]; (B) Reproduced with permission from [8]; (C & D) Reproduced with permission from [9].

