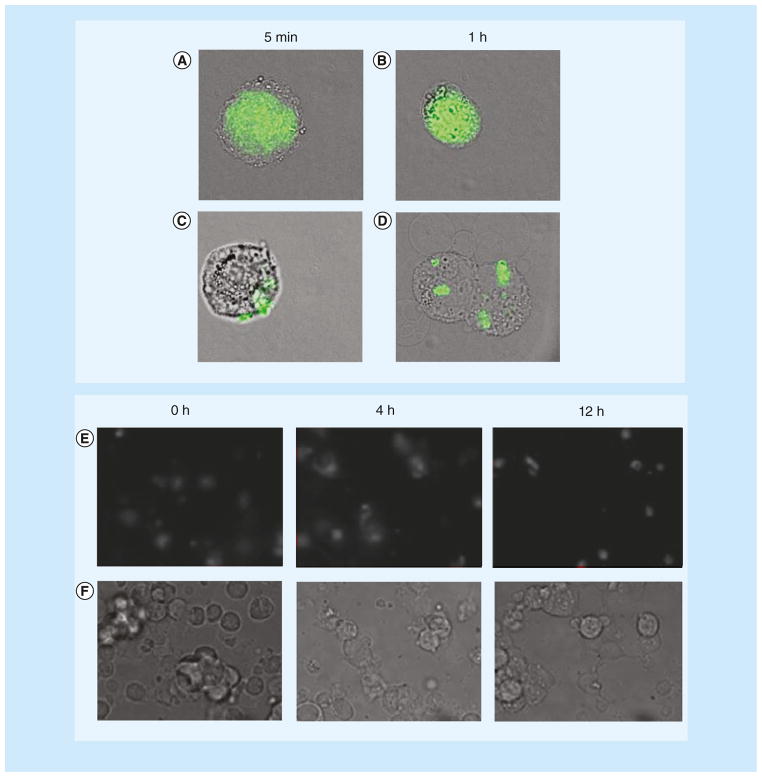
Figure 6. Intracellular kinetics of plasmids after sonoporation.
(A & B) Fluoresently labeled plasmid DNAs show homogeneous distribution in rat mammary carcinoma cells (MAT B III) after sonoporation suggesting diffusion through pores while (C & D) the plasmids are concentrated in vesicles after lipofection, suggesting endocytosis. (E & F) At different time points after sonoporation, plasmid DNAs with fluorescent labels are homogenously distributed inside human embryonic kidney (HEK-293) cells after ultrasound exposure in the presence of microbubbles. (A–D) Reproduced with permission from [78]; (B & F) Reproduced with permission from [79].

