
Figure 6.
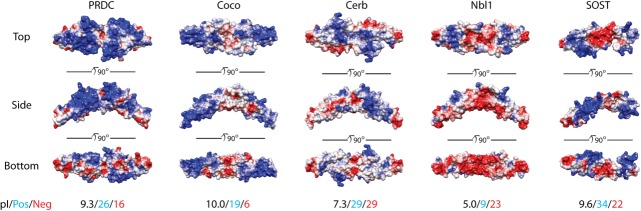
DAN-family electrostatic surface potentials. Surface potentials for several different DAN-family members are shown using top, side, and bottom views. Potentials were calculated using APBS and are colored on a scale of −6 to 6 kbT/ec (red to white to blue).96 Red indicates a negative surface potential while blue represents a positive surface potential. PRDC surface representation is based upon the crystal structure of the dimer. Coco, Cerberus, and Nbl1 were modeled using SwisProt2.0 using PRDC (PDB 4JPH) as an input structure.43,97 These members are plotted as dimers, where Nbl1 is known to exist as a dimer and speculated for Coco and Cerberus. SOST surface potential is based upon the NMR solution of the protein (PDB 2K8P) and is shown as a monomer.66 Beneath the protein surfaces are numbers indicating the pI (black) of each DAN-family protein, the number of positive residues (blue; lysines and arginines), and the number of negative residues (red; glutamates and aspartates) per monomer of each full-length antagonist.