
Figure 7.
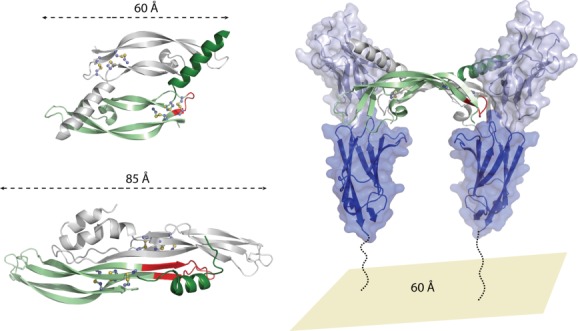
VEGF binding to the VEGFR2 receptor and comparison to PRDC. (top left) Structure of the VEGF-C dimer shown in ribbon representation with one monomer colored green and the opposing colored gray (PDB 2X1X).70 (bottom left) Structure of the PRDC dimer shown in ribbon representation with one monomer colored green and the opposing colored gray.43 For both PRDC and VEGF-C, sticks are shown to represent disulfide bonds. Numbers and lines indicate the length of the proteins from one end to the other. Regions highlighted in red indicated the wrist regions of these proteins. (right) The second and third extracellular domains of VEGFR2 are shown in ribbon and surface representation, colored light and dark blue, respectively. The dotted lines indicate that a substantial portion of the protein is not included in this model (extracellular domains 4–7). For VEGF-C, the wrist region (shown in red) folds out of the when binding to VEGFR2 and is important for mediating the interaction and affinity with this receptor. Number represents the approximate distance between opposing VEGFR2 receptors.