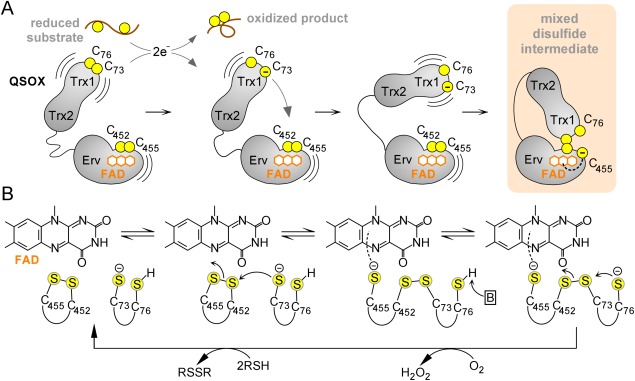
Figure 1.

QSOX catalytic cycle. (A) Schematic diagram of initial steps in QSOX catalysis. Juxtaposed yellow balls represent disulfide-bonded cysteines, and isolated balls represent reduced, unpaired cysteines. Structural domains of QSOX are labeled, and the FAD cofactor is shown as fused orange hexagons. (B) Active-site chemistry. Only the FAD cofactor and sulfur atoms of the CXXC motifs are shown explicitly. Cysteine protonation states at various steps are surmised, and the boxed “B” represents a generic base. An interactive view is available in the electronic version of the article.
