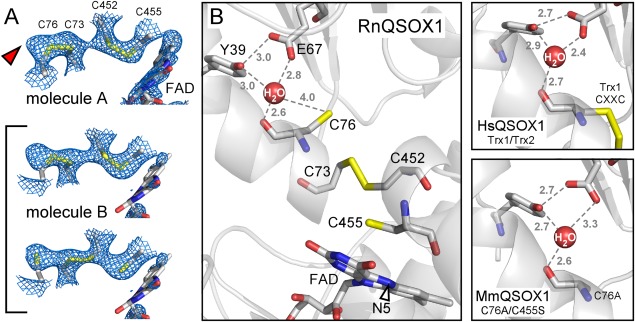
Figure 3.

(A) Simulated annealing omit maps, contoured at 1 σ, in the vicinity of the RnQSOX1 CXXC motifs and FAD isoalloxazine. Cysteine residues and FAD are in stick representation. The alternate conformations that contribute to molecule B are bracketed. The red arrowhead indicates excess density in molecule A, which may indicate a minor population of partially reduced disulfides in this molecule as well. Electron density for the FAD isoalloxazine in molecule B is very poor, suggesting a mixture of redox states or conformational heterogeneity. (B) The putative proton transfer catalyst site of RnQSOX1, including Glu67, Tyr39, and a buried water molecule, is shown in relation to the cysteine ladder descending toward the FAD. Gray numbers are distances in Ångstrom. The N5 position of FAD is indicated by an arrowhead. Also shown is the coordination of the comparable buried water molecules in QSOX fragment and mutant structures (PDB codes 3Q6O and 3T38, respectively).
