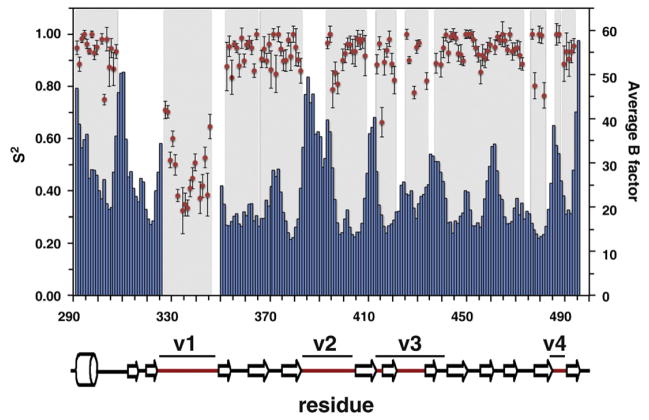
Fig. 1.
NMR assignments and protein mobility. Comparison plot of the amide order parameters S2 determined using model-free approach (red circles) and the average B-factors (blue bars) for the backbone heavy atoms (Cα, C′, and N). Protein segments with missing NMR assignments appear as white gaps in the gray background.

