Fig. 5.
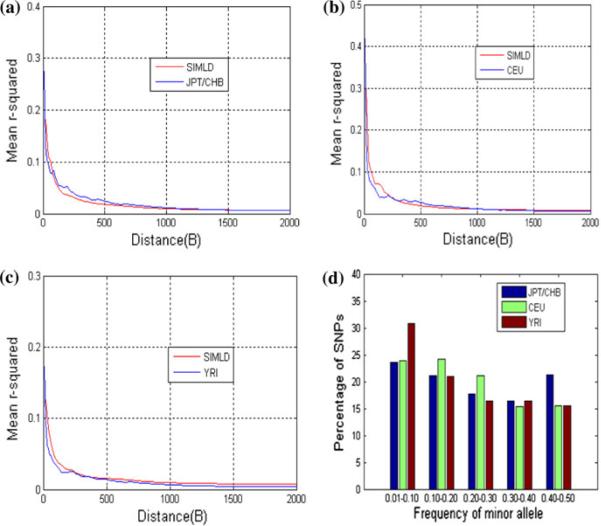
Simulation results for sim2000SNPs_data. LD (mean r2) value as a function of distance across the simulated genome region: red curves are the LD of the simulated data and blue curves are real data for a JPT/CHB, b CEU, and c YRI. d MAF distribution of the simulated 2000 SNPs in the three populations (color figure online)

