
Figure 2.
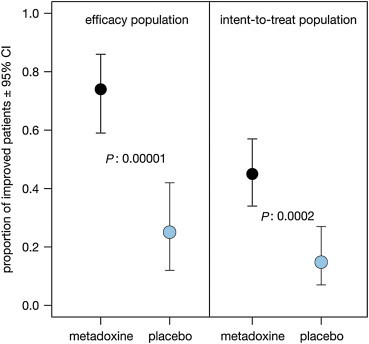
Proportion (with 95% confidence interval) of patients with improved steatosis score at the end of observation. The P-values reported are from the Pearson's chi-square statistic.
Official websites use .gov
A
.gov website belongs to an official
government organization in the United States.
Secure .gov websites use HTTPS
A lock (
) or https:// means you've safely
connected to the .gov website. Share sensitive
information only on official, secure websites.
Proportion (with 95% confidence interval) of patients with improved steatosis score at the end of observation. The P-values reported are from the Pearson's chi-square statistic.