
Figure 3.
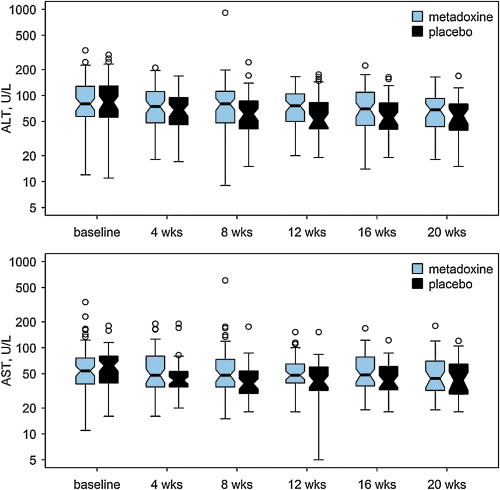
Time course of serum alanine aminotransferase (ALT) and aspartate aminotransferase (AST) shown as box and whisker plot. The thick line indicated the median; the ‘hinges’ indicate the first and third quartile, the notches approximate the asymptotic 95% confidence interval around the median, the whiskers extend to the most extreme data point which is no more than 1.5 times the length of the box away from the box; the dots indicate the outliers.