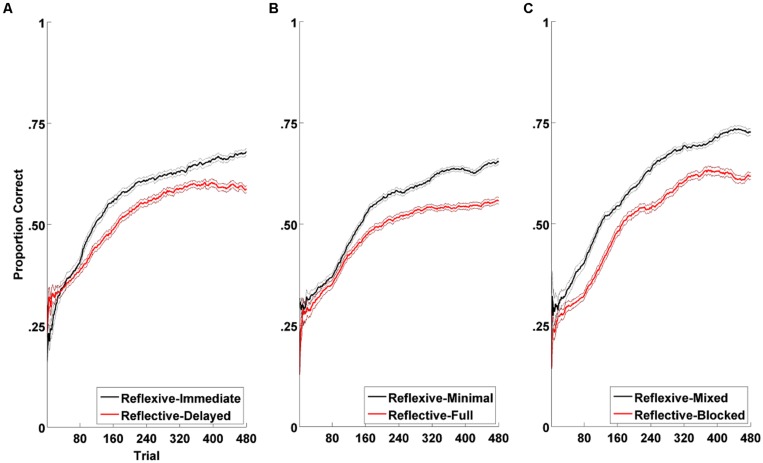
FIGURE 8.
Category learning curves across reflexive vs. reflective conditions in all three experiments from Chandrasekaran et al. (2014): (A) Experiment 1: feedback delay (immediate vs. delayed); (B) Experiment 2: feedback information (minimal vs. full); (C) Experiment 3: speaker variability (mixed vs. blocked). Plotted in solid bold lines are the proportions of correct responses across participants within each condition over the course of learning. The black lines denote the reflexive conditions and the red, the reflective conditions. For purposes of visualization of trial-by-trial data, each point in the line denotes the average number of correct responses in a sliding 80-trial window. For trials preceding the 80th trial, cumulative averages were used. Plotted in thin lines are the ranges of standard error of the averages used in the sliding windows. Visual assessment of the learning curves suggest that both conditions result in equivalent degrees of category learning toward the earlier phase of experiment, but that the reflexive condition leads to greater learning than does the reflective condition toward the later phase of the experiment. This pattern is consistent across all three experiments.

