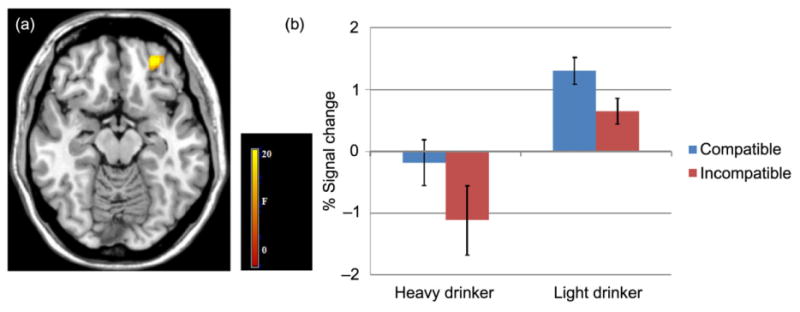
Figure 3.

Group effects during compatible and incompatible association trials. (a) functional magnetic resonance imaging results suggest the left orbital frontal cortex (OFC) showed a significant effect of group; z = −14. (b) Bar graphs show percent (%) signal change for the left OFC activity during compatible and incompatible trials for heavy and light drinkers. Error bars denote within-subject error. Significance set at P < 0.05 FDR-corrected, voxels >30
