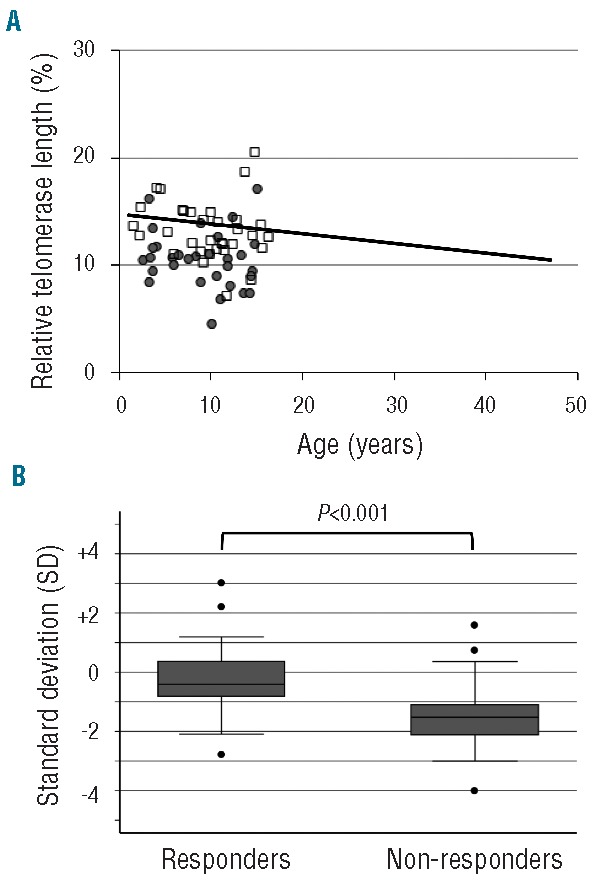
Figure 1.

Relative telomere length in responders and non-responders. (A) Scatter plot of relative telomere length (RTL) versus age in patients with aplastic anemia (AA). The regression line for healthy individuals is shown as a solid line (Y= −0.0907X + 14.751). Results for AA patients were shown for responders (n=33; open squares) and non-responders (n=31; closed circles). (B) Comparison for telomere length between responders and non-responders. Box plots representing the distribution of telomere length in responders (n=33) and non-responders (n=31). The upper and lower limits of the boxes represent the 75th and 25th percentiles, respectively; the horizontal bar across the box indicates the median and the ends of the vertical lines indicate the minimum and maximum data values. Dots indicate outliers.
