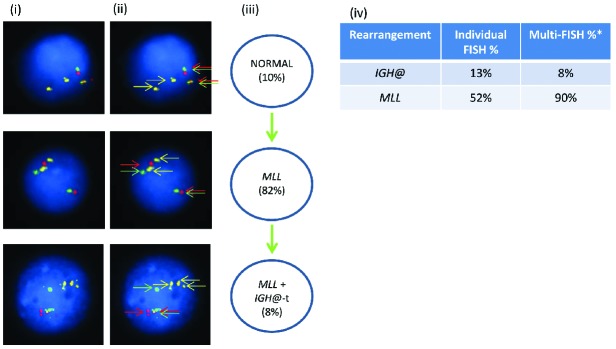
Figure 5.

Images of FISH interphase nuclei depicting the apparent emergence of an MLL translocation prior to the IGH@-t. (i) Captured inter-phase nuclei from patient 21940 hybridized with FISH probes to track the MLL translocation using a dual color MLL breakapart probe (Vysis, Abbott Molecular) (red/green) and home-made IGH@ probe (gold). (ii) The same captured interphase nuclei, including colored arrows highlighting the signals that were scored: the yellow arrows highlight the gold probe marking the home-made IGH@ probe that detects both the copy number of chromosome 14 and also the presence of a translocation. The red/green double arrows highlight the dual color MLL breakapart probe that marks the MLL translocation. (iii) Cartoon depicting a possible model of evolutionary progression. An MLL rearrangement was observed in 82% of cells and an additional IGH@-t in 8% of cells. (iv) Table showing the percentages of positive nuclei when samples were hybridized with either the individual probes for each rearrangement (Individual FISH), or when they were investigated together (Multi-FISH) in the same cell. *percentages may vary between the FISH results obtained when using an individual probe, and probes in combination, likely reflecting scoring by automation versus scoring by eye and increased interference and obscuring of signals when there are many of them.
