Figure 6.
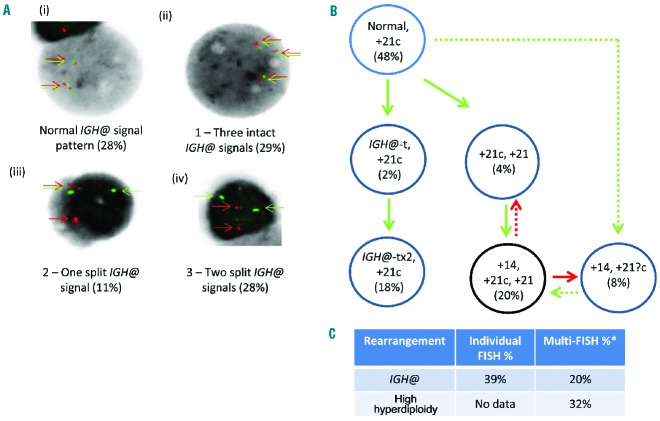
Dual color and multiple color FISH showing independent aneuploid and IGH@-t clones in patient 24390. (A) Dual color IGH@ FISH showing the presence of a normal clone (i) and three abnormal clones (ii,iii,iv). The red/green colored arrows highlight the signals that were scored. The first abnormal clone (ii) shows an additional copy of the IGH@ intact fusion, the second abnormal clone (iii) shows the separation of one fusion indicating the presence of a translocation involving one IGH@ locus and the third abnormal clone (iv) shows the separation of both IGH@ fusions suggesting the presence of two IGH@-t. (B) Cartoon depicting the potential clonal evolution by either gain (green arrows) or loss (red arrows). Solid and dashed lines highlight the possible alternative evolutionary routes taken by the sample. Two intact IGH@ signals with three copies of chromosome 21 were observed in 48% of nuclei. This clone evolved into two independent sub-clones. The first showed evolution within the high hyperdiploidy clone with additional copies of chromosome 21 (4%), both chromosome 14 and 21 (20%) and loss of one copy of chromosome 21 (8%). The second sub-clone harbored a single IGH@-t followed by rearrangement of the second IGH@ locus (18%). The black circles represent the FISH signal patterns which correlate with the karyotypes observed at metaphase analysis. (C) Table showing the percentages of positive nuclei when samples were hybridized with either the individual probes for each rearrangement (Individual FISH), or when they were investigated together (Multi-FISH) in the same cell.

