
Figure 1.
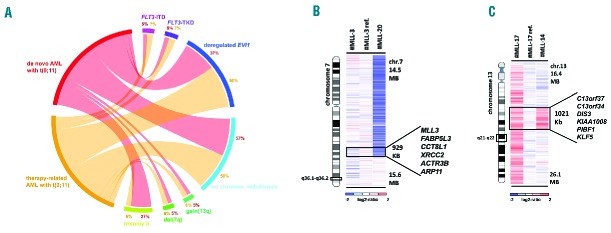
(A) Circos-plot illustration of recurrent secondary genetic alterations in 22 de novo (red) and 16 t-AML cases (orange) with t(9;11). Frequencies of respective lesions are indicated in percent [deregulated EVI1 = over-expressed EVI1; no chromos. imbalances = cases lacking any CNAs]. (B and C) Heat map of recurrently altered regions in t(9;11)-positive AML. (B) Log2-ratio SNP copy number data of deletion 7q36.1-q36.2 involving MLL3 showing one large and one micro-deletion [ref.: paired normal control; minimally altered region (MAR) containing 6 genes as indicated]. (C) Gain of 13q21.33-q22.1 involving KLF5 and DIS3 [ref.: paired normal control; MAR is defined by case #MLL-14 including 6 genes].