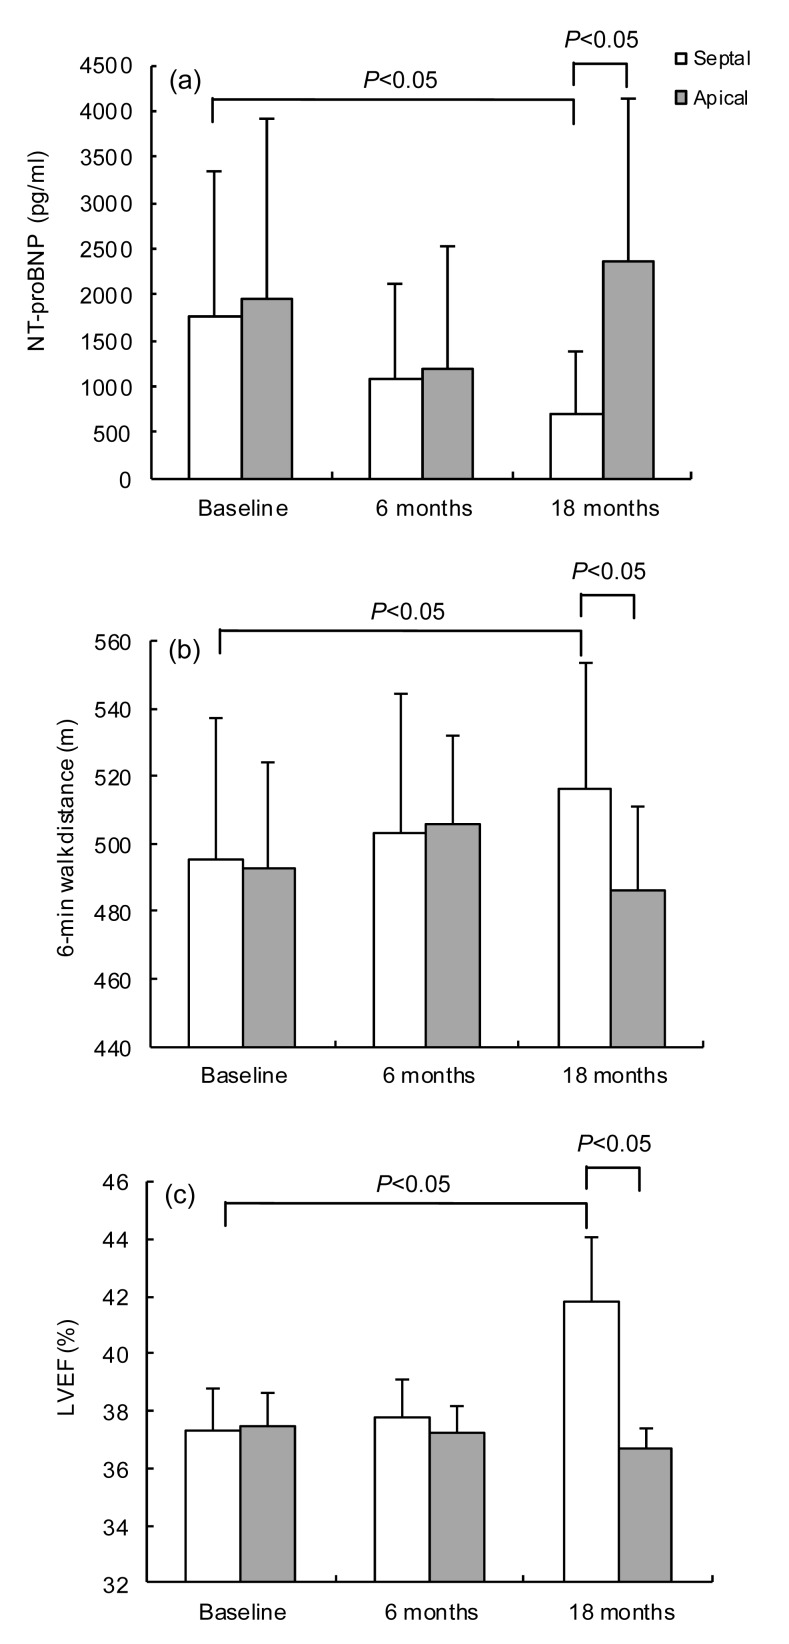
Fig. 2.
BNP (a), 6MWT (b), and LVEF (c) at baseline and during follow-up in patients with 35%<LVEF≤40%
(a) Patients randomized to the RVMSP group with 35%<LVEF≤40% at baseline have an obvious BNP which is decreasing during follow-up compared with those in the RVAP group (P<0.05); (b) 6WMT shows a significant increase in patients with 35%<LVEF≤40% allocated to the RVMSP group compared with the RVAP group after 18 months’ follow-up (P<0.05); (c) After 18 months’ follow-up, patients with 35%<LVEF≤40% at baseline allocated to RVMSP have a significant increase compared with RVAP (P<0.05). Data are expressed as mean±SD

