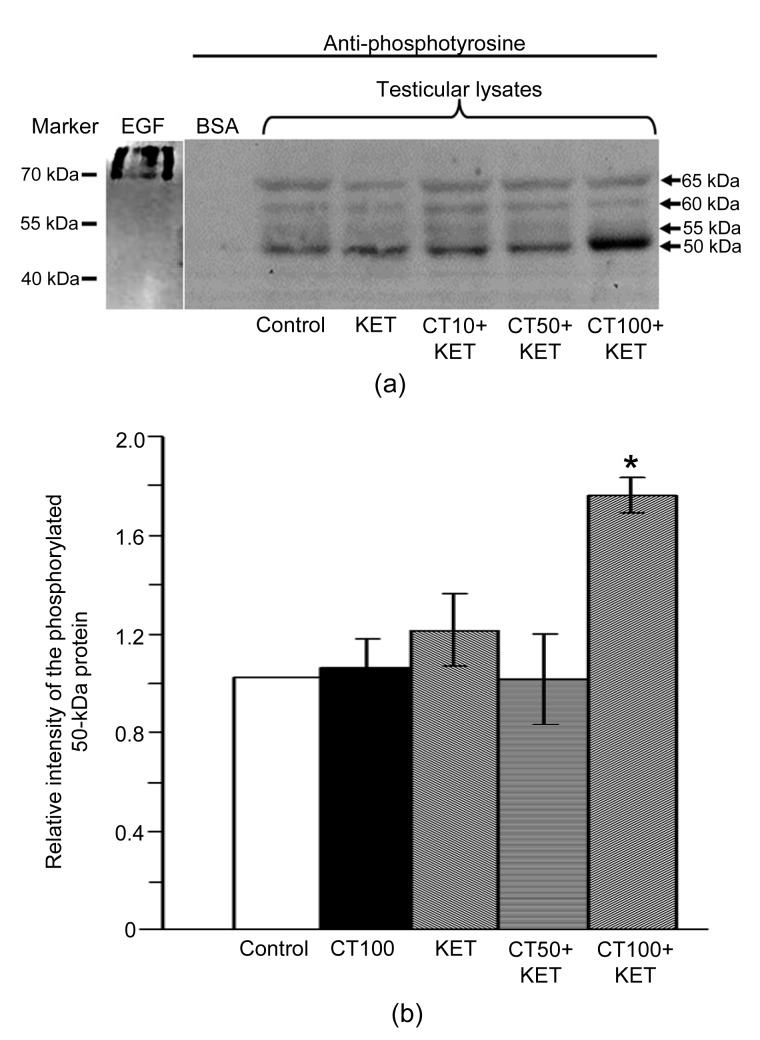
Fig. 3.
Immuno-Western blot analysis for tyrosine protein phosphorylation levels in testicular lysates (a) and relative intensity of the phosphorylated 50-kDa protein of testicular lysate (b)
In (a), 60 μg protein is for each lane of control, KET, and CT+KET groups. Bovine serum albumin (BSA) and epidermal growth factor (EGF)-like growth factor were used as negative and positive controls for phosphotyrosine antibody, respectively. In (b), data are expressed as mean±SD (n=3). * P<0.05 vs. control

