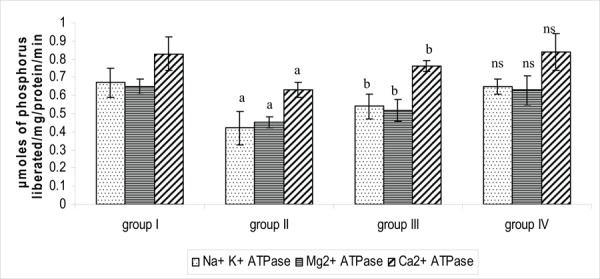
Fig. 3:

Effect of PA on the activity of ATPases in the brain tissue of control and experimental groups of rats. Each value is expressed as mean_S.D. for six rats in each group. ATPases are expressed as micromoles of phosphorus liberated/mg/ protein/min. Statistical significance: * p<0.05. a: Group II compared with Group I. b: Group II compared with Group III. NS-not significant. Group IV compared with Group I.
