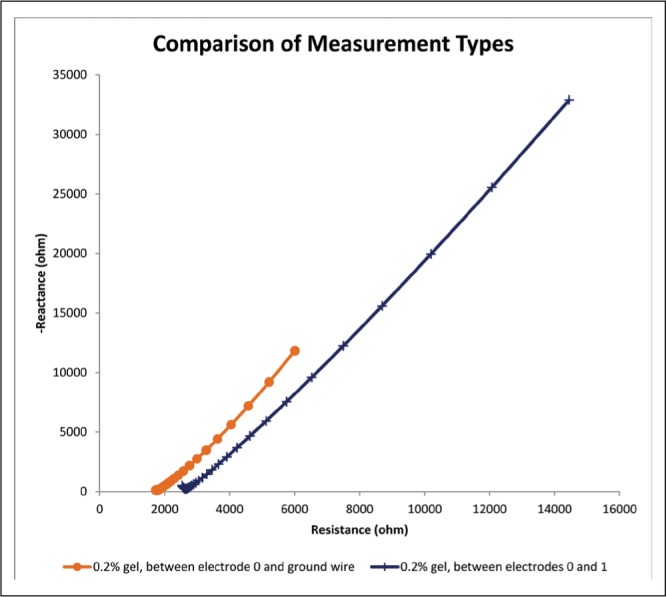
Fig. 13:

This graph depicts impedance spectra for 0.2% gels in both measurement conditions. Notice the much higher magnitudes of both resistance and reactance in the bipolar measurement condition as compared to the monopolar measurement condition.

This graph depicts impedance spectra for 0.2% gels in both measurement conditions. Notice the much higher magnitudes of both resistance and reactance in the bipolar measurement condition as compared to the monopolar measurement condition.