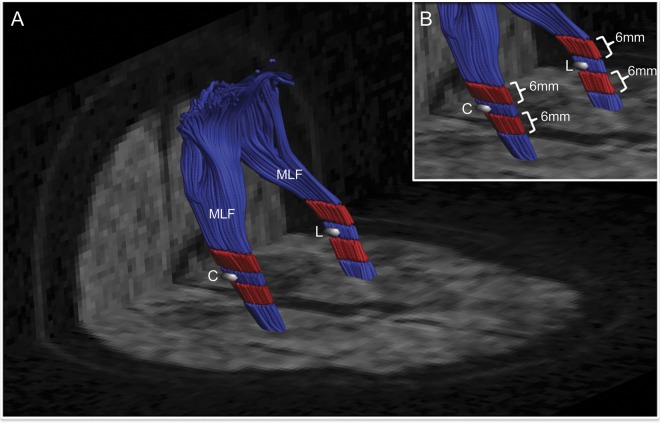
Figure 1. Representative ROIs for analysis.
(A, B) Reconstruction of the MLF tract containing the DWI lesion (L) and the corresponding contralateral control ROI (C) at the time of lesion detection in subject B. FA and MD were measured within the lesion and control ROIs (white), the 6-mm segments surrounding the ROIs (red), and along the full bundles (red plus blue). DWI = diffusion-weighted imaging; FA = fractional anisotropy; MD = mean diffusivity; MLF = middle longitudinal fasciculus; ROI = region of interest.

