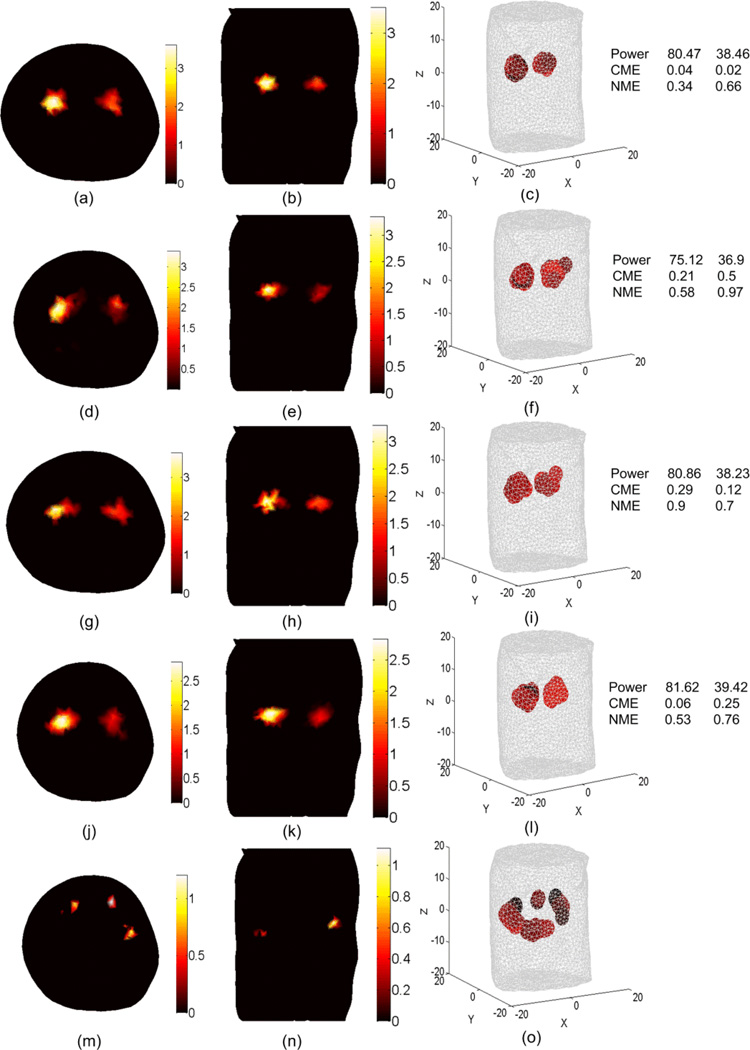
Figure 11.
BLT reconstruction of two uniform bioluminescence sources where the actual sources are the same as shown in the first row of Figure 10. The source-detectors setup used for the DOT and BLT is as shown in Figure 3(b) where 12 views with 300 degree field of view for each view is used for the DOT and 360 degree field of view used for the BLT. The reconstructed sources are shown in (a), (b), and (c) using the DOT results shown in Figure 7 (d), (e), and (f) where segmentation using CT-scan is used. The reconstructed sources are shown in (d), (e), and (f) using the non-segmented object DOT results shown in the second row of Figures 4 and 5. (g), (h), and (i) show the BLT results where adaptive segmented object DOT results, shown in Figure 8, with (f = 0 Hz) used. (j), (k), and (l) show the BLT results where adaptive segmented object DOT results, shown in Figure 9, with (f = 100 MHz) used. (m), (n), and (o) show the BLT results where homogenous object DOT results used.

