
FIGURE 1. Sample false-color images of microfluidic digital PCR chips.
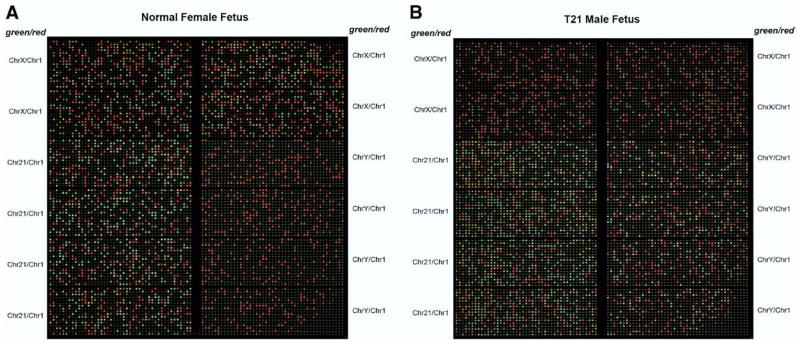
These images are produced by overlaying the subtracted images in both fluorescent channels. FAM signal is shown in green, and HEX signal is shown in red. A red square represents a compartment containing amplification products giving out signal in the HEX channel (chromosome 1 locus). A green square represents a compartment containing amplification products giving out signal in the FAM channel (chromosomes X, Y, or 21 loci, as labeled on the sides of the images). A yellow square is an overlap of a red and a green square. A, Normal female fetus (46 XX). The number of green squares is comparable to that of red squares in panels targeting chromosomes 21 and X. No green squares are present in panels targeting chromosome Y. B, Male fetus with trisomy 21 (47 XY +21). The number of green squares is approximately half that of red squares in panels targeting chromosomes X and Y. More than expected number of green squares is observed in panels targeting chromosome 21. Comparison of green and red square counts reveals a ratio of approximately 3:2.