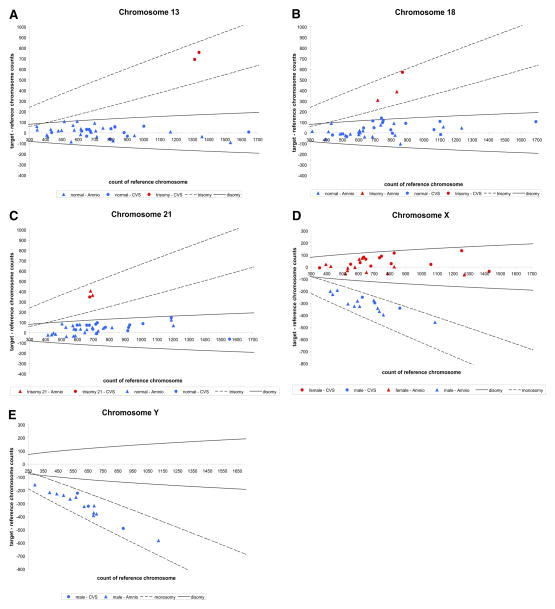
FIGURE 2. Digital PCR results.
For each sample, the difference between target and reference chromosome counts is plotted against the reference chromosome count. The boundaries represent 99.9% confidence interval of each cases of ploidy. A, Chromosome 13 as the target chromosome. All but 2 samples fell within the region of disomy. Two cases of trisomy 13 were detected. B, Chromosome 18 as the target chromosome. Three cases of trisomy 18 were detected. The rest were determined to be normal. C, Chromosome 21 as the target chromosome. Three cases of trisomy 21 were detected. The rest were determined to be normal. D, Chromosome X as the target chromosome. All female samples fell within the region of disomy, while all male samples lied within the region of monosomy. E, Chromosome Y as the target chromosome. All male samples fell within the region of monosomy. None of the female samples showed amplification for chromosome Y assay.

