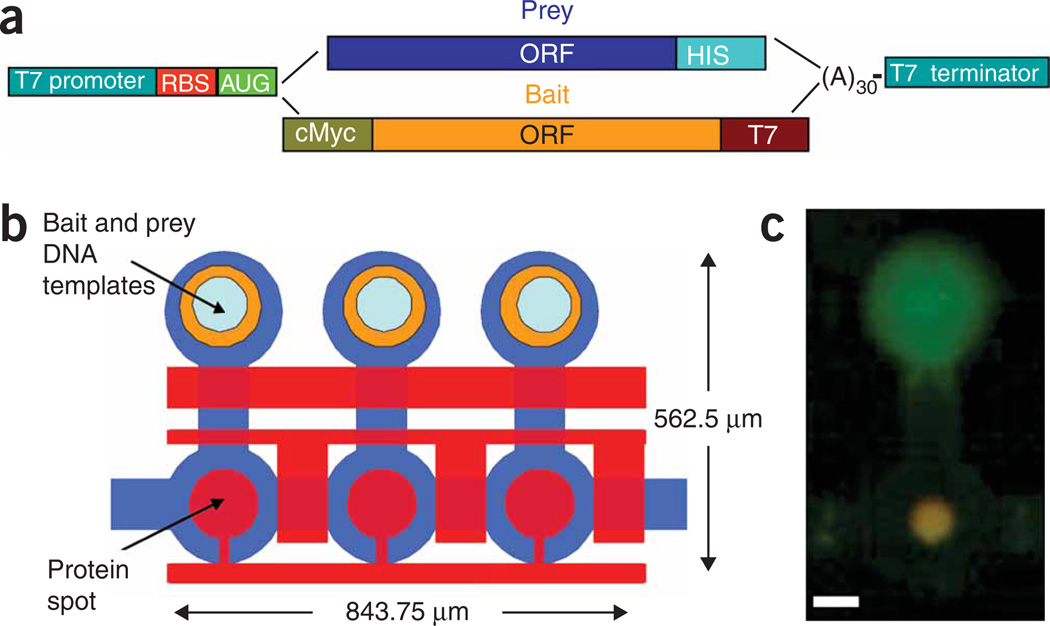
Figure 1.
Experimental design. (a) Graphical representation of expression template design. Both bait and prey DNA templates include a T7 promoter, ribosome binding site (RBS), poly(A) and T7 terminator. The bait library includes a c-myc tag for measuring expression and a T7 tag for protein pull-down. The prey library includes a His tag for detecting interactions. (b) Schematic of the device layout. Each unit cell is controlled by three micromechanical valves as well as a ‘button‘ membrane used for surface derivatization and MITOMI. Bait and Prey DNA templates are aligned under the chip’s DNA chambers in which proteins are expressed. Pull-down antibody is deposited under the button valve. Unit cell size is 281.25 mm by 562.5 mm and an area of 158,203 mm2. Average cell height is 10 mm, and average cell volume is less than 1 nl. Unit cell density is 632 cm−2. (c) Image of a typical bait (green) and prey (red) interaction on chip. Interaction is in orange owing to overlay of the two channels. Scale bar, 100 mm.

