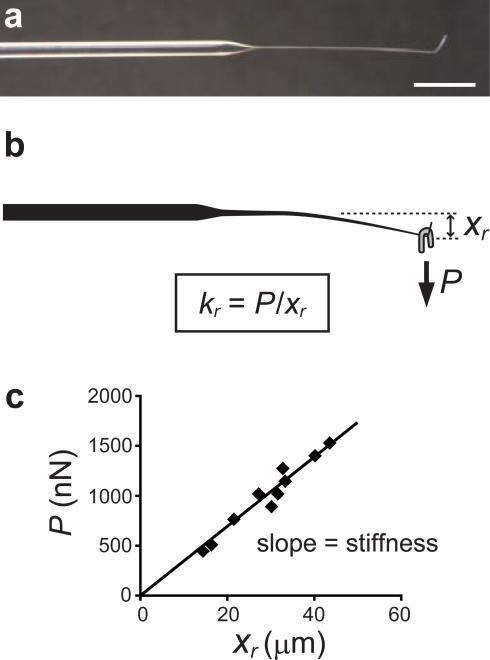
Figure 2.
Calibration of the reference needle. (a) Image of the reference needle. Scale bar, 5 mm. (b) A horse-shoe shaped weight (gray) is hung on the L-shaped tip of the reference needle to apply a load (P, nN). This results in the vertical displacement of the needle tip (xr, μm). The stiffness of the reference needle (kr) is determined by the slope of the load-displacement relationship obtained using several different weights. An example of a calibration data set is shown in (c) (see also Table 1 for description of the variables used.).

