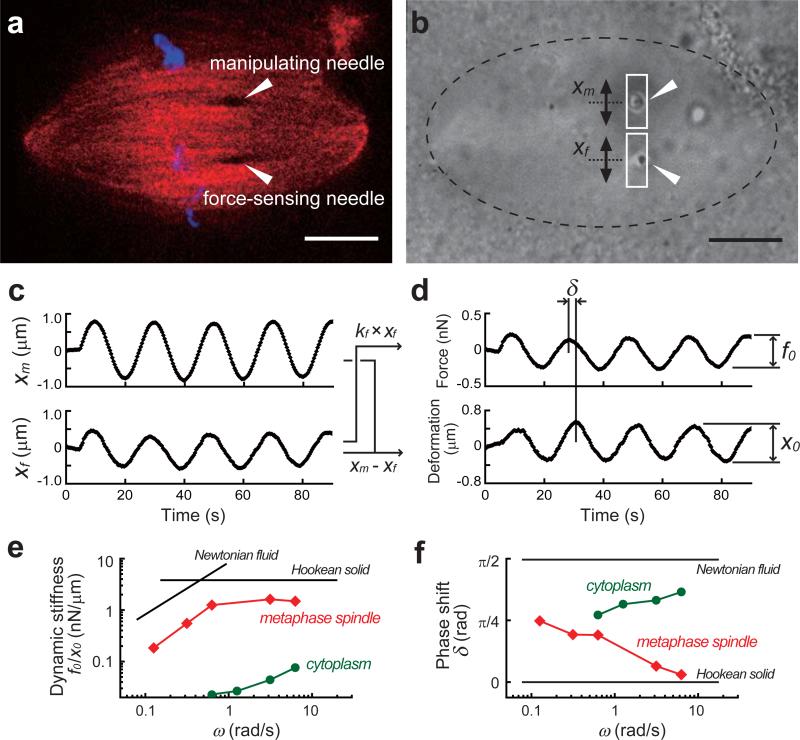
Figure 5.
An example of an experiment and analysis. (a) A metaphase spindle is visualized by confocal imaging of chromosomes (SYTOX-dye, blue) and spindle microtubules (X-rhodamine tubulin, red). The positions of the microneedle tips (dark spots in the structure) are indicated (arrow heads). (b) Bright field images are used to track the motion of the two microneedle tips (arrow heads). The manipulating microneedle can be moved via the piezo actuator along the spindle's short axis. A rectangular ROI is drawn around each microneedle tip and analyzed. Scale bars, 10 μm. (c) The motions of the manipulating microneedle tip (xm) and the force-sensing microneedle tip (xf) are measured. (d) Force is determined by multiplying the displacement of the force-sensing microneedle tip by its pre-calibrated stiffness (i.e., kf × xf). The distance between the two microneedle tips (i.e., xm – xf) yields deformation. The amplitudes of the force and deformation (f0 and x0) and the phase shift (δ) between the two responses can be obtained by fitting the responses to sinusoidal functions. (e, f) An example of the frequency-dependent change in the viscoelastic properties of the metaphase spindle (red squares) and the cytoplasm (green circles). The dynamics stiffness (f0/x0) and the phase shift (δ) are determined at 4-5 different frequencies. The graphs also show typical responses of a perfect elastic solid (Hookean solid) and a linear viscous fluid (Newtonian fluid). Note that the absolute value in (e) depends on the material (see also Table 1 for a description of the variables used).

