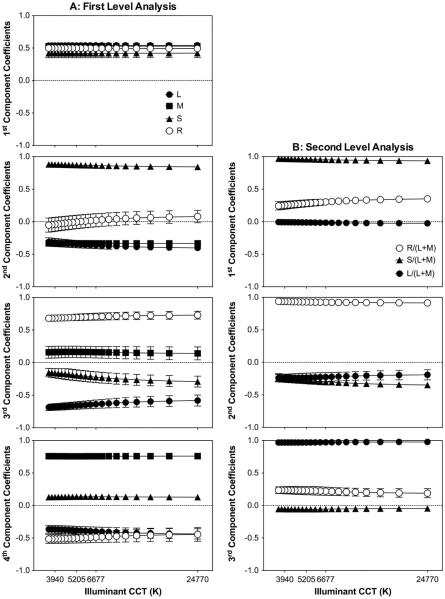
Fig. 2.
Rhodopsin- and cone-opsin-based analysis. The coefficients values averaged for the nine images versus the CCT of the “D” illuminants are shown. Each panel corresponds to one of the four principal components corresponding to the first level of analysis (A, left column), or to one of the three principal components corresponding to the second level of analysis (B, right column). Error bars are the standard deviation of the results for the nine images.

