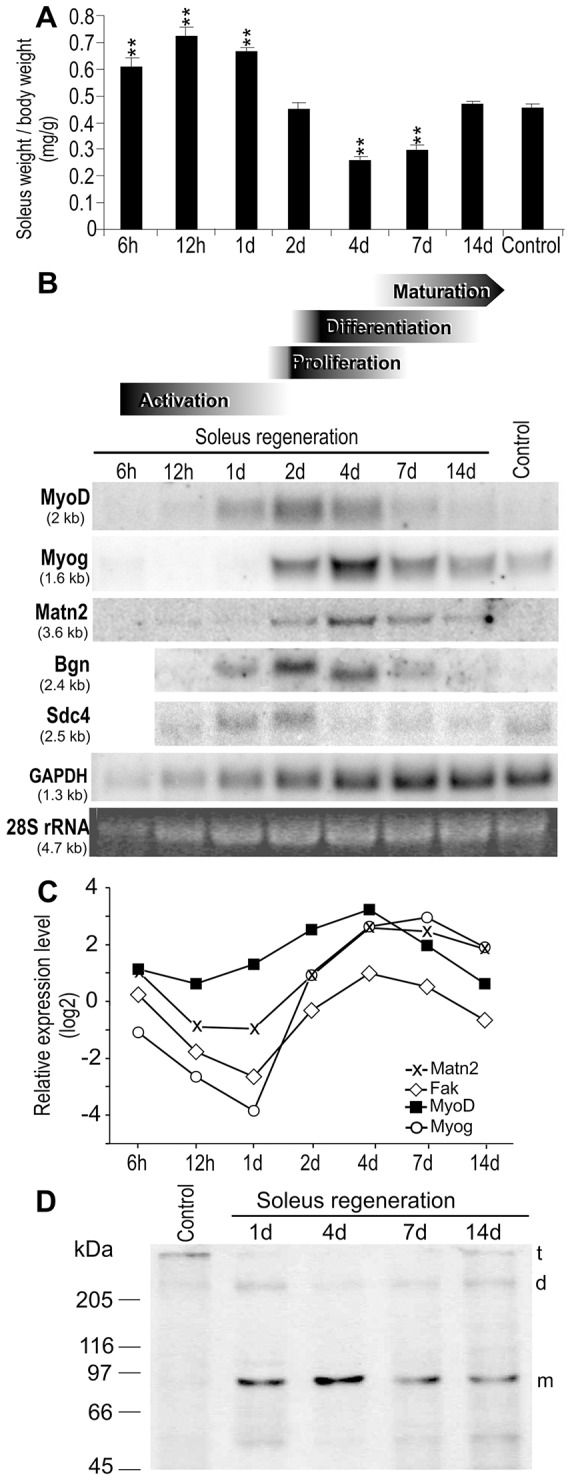
Fig. 1.

Marker gene expression during rat soleus regeneration. (A) Weight changes during notexin-induced regeneration. Data show the mean±s.e.m. (n≧3); **P<0.01. (B,C) Kinetic changes in marker gene expression were aligned with the stage of regeneration (Shi and Garry, 2006), based on histological analysis of H&E-stained sections (Fig. 2A). Pooled total RNA derived from control and regenerating samples (n = 3) was subjected to northern hybridization (B) and QRT-PCR using the SYBR green protocol (C). For QRT-PCR, relative expression levels normalized to those of the untreated control (ΔΔCt) are shown. (D) Immunoblot analysis of Matn2 expression during regeneration. t, trimer; d, dimer; m, monomer.
