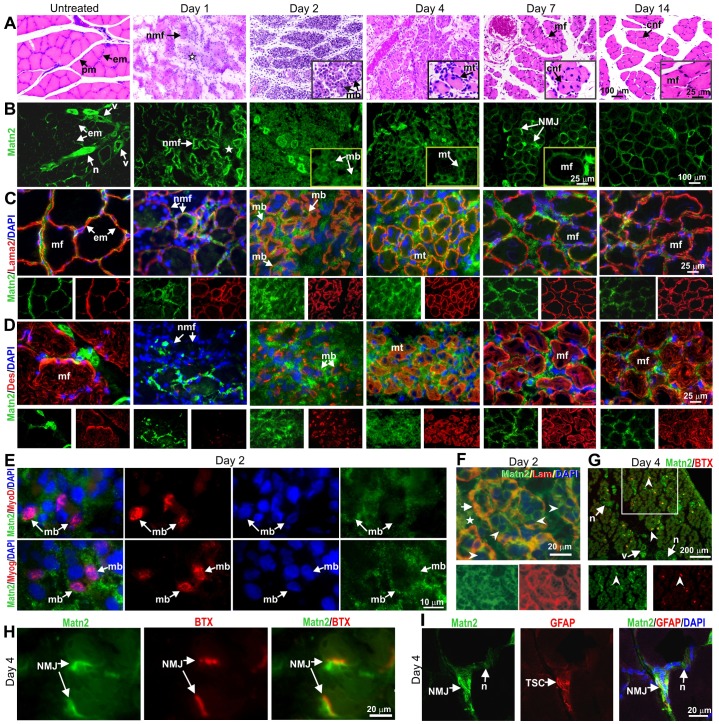
Fig. 2.
Progress of morphological changes and Matn2 deposition during rat soleus regeneration. (A) H&E staining of transverse paraffin sections. The star indicates inflammatory cells. (B–D) Immunofluorescence of serial cryosections for Matn2 (B–D) and laminin α2 (Lama2) (C) or desmin (Des) (D). The star indicates interstitial tissue (B). (E) Deposition of Matn2 around MyoD- and Myog-expressing proliferating and differentiating myoblasts at day 2 post-injury. (F) Matn2 deposition in the interstitial tissue (star) and around myoblasts (arrowhead) differentiating and fusing within the basement membrane, which is also stained for laminin-111 (Lam, arrow), at 2 days post-injury. (G–I) Localization of Matn2 to NMJs on day 4. Note the strong Matn2 signal at the newly established NMJs, as visualized by Rhodamine-labeled α-bungarotoxin (BTX) staining of acetylcholine receptors (G, arrowhead). There is partial overlap between Matn2 and α-bungarotoxin signals at NMJs (H, arrows). TSCs visualized by GFAP staining are covered by Matn2-rich ECM at the NMJ (I). Insets show a section of the main image at higher magnification (A,B). Single-channel images of the entire image (C,D,F) or the outlined area (G) are shown beneath the main image. cnf, centrally nucleated myofiber; em, endomysium; mb, myoblast; mf, myofiber; mt, myotube; n, nerve; nmf, necrotic myofiber; pm, perimysium; v, blood vessel.

