Fig. 8.
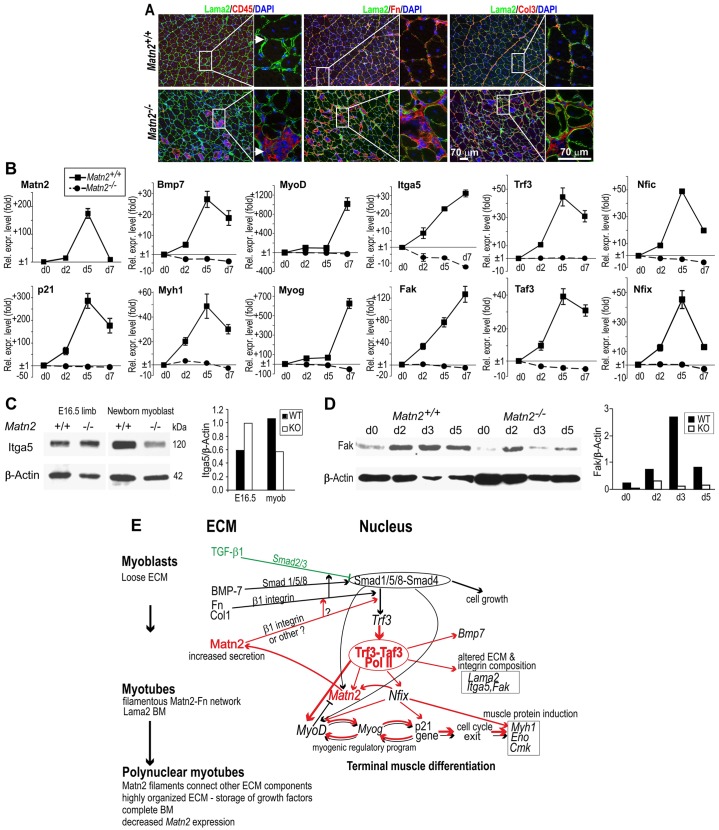
The effect of Matn2 on marker gene expression during myoblast differentiation. (A) Impaired regeneration at day 28 in Matn2−/− mice. Necrotic myofibers accumulate, which attracts numerous CD45-positive inflammatory cells (arrow), leading to increased fibronectin and collagen-3 deposition (magnified insets). (B) QRT-PCR analysis of marker gene expression in ex vivo differentiating myoblast cultures derived from Matn2−/− and Matn2+/+ newborn mice, performed using the SybrGreen protocol. Results show the mean±s.e.m. (C) Immunoblot analysis of integrin α5 in limbs of E16.5 embryos and in wild-type (WT) and Matn2−/− (KO) primary myoblast cultures. (D) FAK detection by immunoblotting in myoblast cultures differentiating ex vivo. For C and D, the proteins were quantified by densitometry. (E) A model of myoblast differentiation. Regulatory interactions linking Matn2 expression to myoblast differentiation are illustrated schematically. Red arrows indicate activation processes affected directly or indirectly by Matn2 signaling. BM, basement membrane; Fn, fibronectin.

