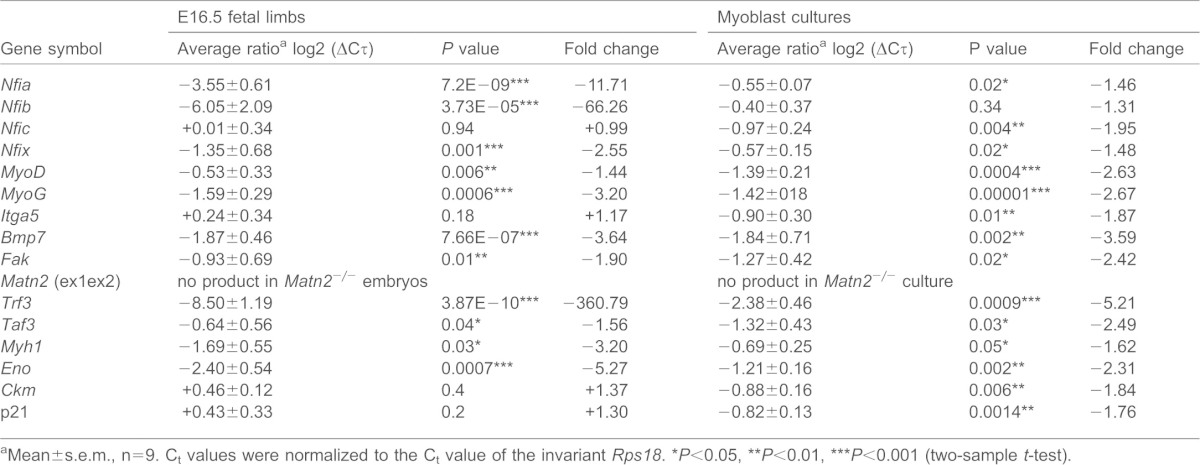
Table 1. Comparison of the expression levels of marker genes in fetal limbs and myoblast cultures from Matn2−/− versus wild-type mice by QRT-PCR.

Mean±s.e.m., n = 9. Ct values were normalized to the Ct value of the invariant Rps18.
P<0.05,
P<0.01,
P<0.001 (two-sample t-test).
