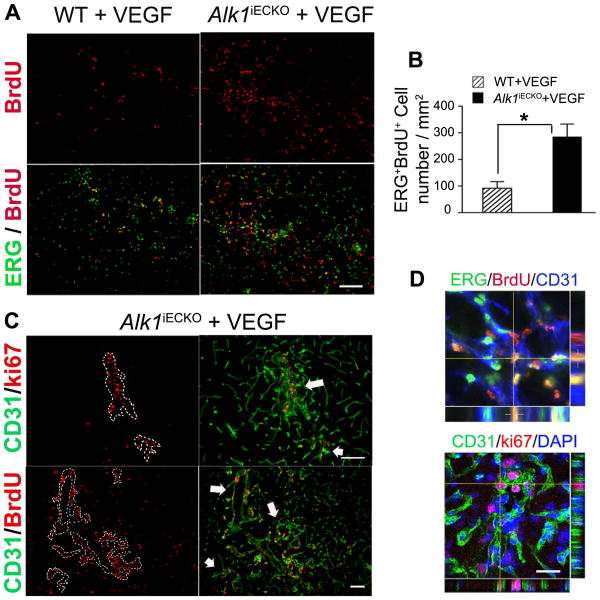
Figure 3. Increased EC proliferation in the angiogenic foci of Alk1iECKO+VEGF mice.
(A) BrdU+ (red) EC nuclei (ERG+, green) in the angiogenic foci of WT+VEGF and Alk1iECKO+VEGF mice. Scale bar: 100 μm. (B) Quantification of ERG+/BrdU+ ECs. (C) Proliferating ECs (Ki67+ or BrdU+) are clustered on the dysplastic vessels (outlined by dotted lines in the images on the left and indicated by arrows in the images on the right). Scale bar: 100 μm. (D) Confocal image showing colocalization of BrdU (red) and ERG (green, top), and ki67 (red) and CD31 (green, bottom) positive staining. The nuclei were counterstained with DAPI (blue). Scale bar: 20 μm.

