
Figure 1.
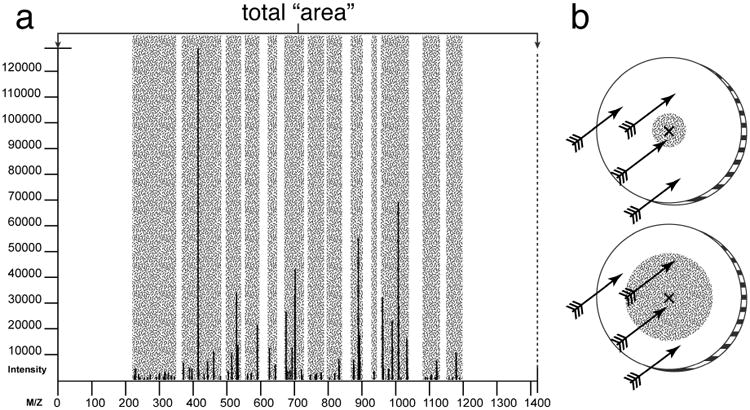
Peak coverage of an MS/MS spectrum. Panel “a” shows a spectrum coverage “area”; the gray shading represents the area covered when fragment tolerance is taken into account. (For illustrative purposes, the fragment tolerance represented in this figure is exaggerated far beyond what is appropriate for a modern mass spectrometer. Panel “b” represents peak coverage with varying error tolerances to targets with varying bull's-eye radii.