
Figure 3.
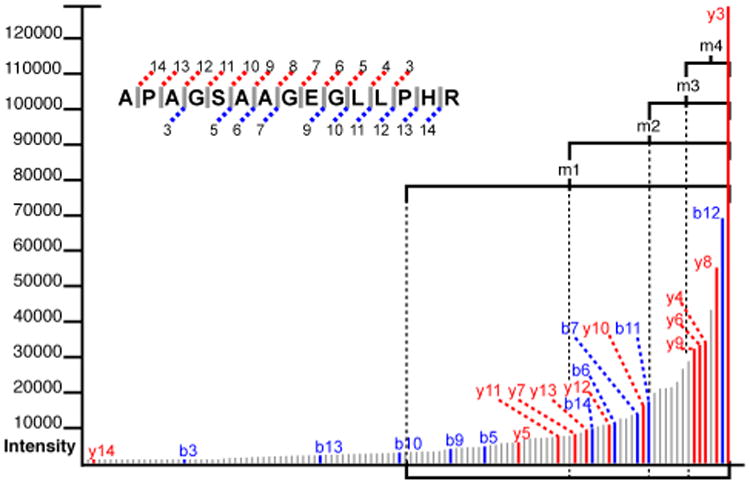
Medians above medians. Here the fragment ions of Figure 2 have been arranged in order of intensity. The peaks matching to the theorized peptide sequence have been labeled. This figure illustrates the heuristic that true alignments tend to occur with peaks of greater abundance. Here, m1, m2, m3 and m4 denote the peaks with abundances in the top 50%, 25%, 12,5% and 6.25%, respectively.