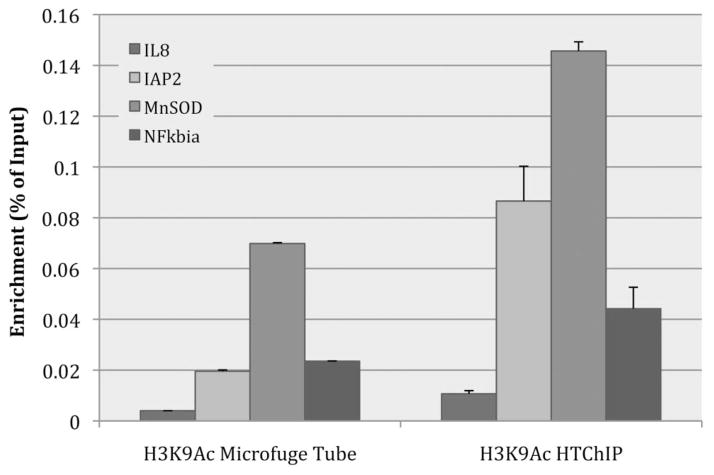
Fig. 3.
Bar graph comparing IP efficiency between IP performed in a microcentrifuge tube on the benchtop, and the microfluidic environment of HTChIP. ChIP was performed using anti-acetylated-histone-3-lysine-9. The HTChIP signal was significantly higher than the signal from the microcentrifuge tube based method, with a p-value < 0.01 (unpaired Student’s T-test) for each genomic loci tested. Since the metric being compared is raw IP efficiency, enrichment values were not normalized to any background or control ChIP, but rather displayed as ratio to non-normalized Input values. Error bars represent standard error over three (3) PCR replicates.

