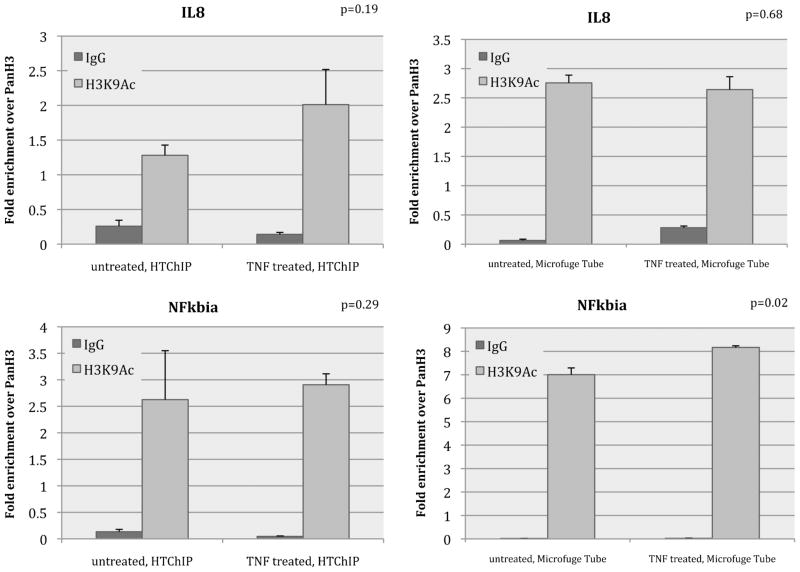
Fig. 4.
Bar graphs showing ChIP enrichment of H3K9Ac of HeLa cells with and without TNF-α stimulation, measured at NFκB target promoters. Left graphs show results obtained using HTChIP; right graphs show results obtained using conventional benchtop protocol. Each graph shows H3K9Ac enrichment at the loci of interest without TNF-α stimulation on the left, and with 1 h of TNF-α treatment on the right. For benchtop ChIP, there is no significant difference between H3K9Ac levels at these gene promoters in untreated and treated cells; data from HTChIP leads to the same conclusion (Bonferroni corrected unpaired Student’s T-test at α = 0.01). Both sets of results concur with those previously reported in literature. In each ChIP, enrichments were normalized to PanH3 levels for comparability, and non-specific anti-IgG was used as background control. Error bars represent standard error over three (3) PCR replicates for both HTChIP and benchtop ChIP experiments.

